


Digital SAT Math Prep: Real-World Linear Equations Guide

A municipal maintenance crew is completely draining a commercial swimming pool to perform structural repairs. The graph above models the volume of water, V, in thousands of gallons, remaining in the pool t hours after the drainage pump is turned on. Question: Based on the graph, at what constant rate, in thousands of gallons per hour, is the water being drained from the swimming pool? • A) 10 • B) 12 • C) 50 • D) 60

Digital SAT Math Prep: Real-World Linear Equations Guide

SAT Saturday Week 12: Mastering Real-World Linear Equations

Welcome back to another high-impact edition of SAT Saturday!
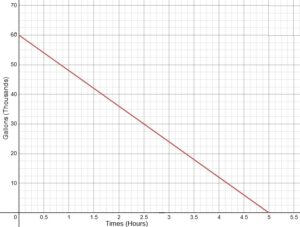
A municipal maintenance crew is completely draining a commercial swimming pool to perform structural repairs. The graph above models the volume of water, V, in thousands of gallons, remaining in the pool t hours after the drainage pump is turned on.Question: Based on the graph, at what constant rate, in thousands of gallons per hour, is the water being drained from the swimming pool? • A) 10 • B) 12 • C) 50 • D) 60
Based on the graph, at what constant rate, in thousands of gallons per hour, is the water being drained from the swimming pool?

As we roll past the middle of July, we are pivoting our strategy toward the undisputed heavyweight champion of the Digital SAT Math section: The Heart of Algebra. Algebra questions make up roughly 35% of your entire math score, and the vast majority of those questions focus on how linear relationships operate in the real world.

The College Board loves testing whether you can look at a standard linear equation and understand exactly what its moving parts represent in a practical setting. They don’t just want you to solve for x — they want you to tell them what x means.

Today, we are attacking two high-frequency linear algebra challenges: interpreting the real-world meaning of constants and building structural equations directly from descriptive word problems.

Grab your notebook, warm up your Desmos workspace, and let’s conquer these linear models!


This Week’s Linear Algebra Challenges

Question 23  Linear Equations – Interpreting the Parts (High Frequency on the SAT)

A local solar energy company installs rooftop solar panels. The total cost, y, in dollars, for a customer to have solar panels installed and maintained for x months is modeled by the equation below:

y = 125x + 3,800

What is the best interpretation of 3,800 in this context?

  • A) The monthly maintenance fee charged by the company.
  • B) The total number of months the solar panels are under warranty.
  • C) The initial cost to purchase and install the solar panels.
  • D) The expected dollar amount saved on electricity each month.

Question 24  Linear Equations

Creating an Equation from a Context

An online bookstore charges a flat shipping fee per order plus a fixed price for each paperback novel purchased. An order of 4 paperback novels costs a total of $31.00. An order of 7 paperback novels costs a total of $49.00. Which equation represents the total cost, C, in dollars, for an order of n paperback novels?

  • A) C = 6n + 7
  • B) C = 7n + 6
  • C) C = 6n + 31
  • D) C = 4n + 49

Week 11 Answer Key & Explanations

Let’s dive into the step-by-step conceptual logic and full math proofs for last week’s Statistics challenges so you can verify your scores!

A real estate agent tracks the listing prices of 20 houses in a specific zip code. The table below summarizes the distribution of the listing prices.

Listing Price

Number of Houses

$250,000

5

$275,000

8

$300,000

6

$1,200,000

1

The agent discovers that the house listed at $1,200,000 was entered in error and removes it from the dataset. Which of the following statements best describes the effect of removing this data point?

  • A) The mean decreases, and the median decreases.
  • B) The mean decreases, and the median remains the same.
  • C) The mean remains the same, and the median decreases.
  • D) The mean increases, and the median remains the same.

The SAT “Shortcut” Method (Conceptual Logic)

Because the SAT is a timed exam, high-scoring students learn to solve outlier questions conceptually without performing heavy arithmetic:

  • The Mean: The $1,200,000 home is a massive outlier on the high end of the dataset. It acts like a heavy anchor pulling the average (mean) upward. Removing this extreme high value will cause the mean to decrease.
  • The Median: The median is the middle data point. In a group of 20 homes, the middle falls between the 10th and 11th value. Looking at the frequency column, the first 13 homes (5 + 8) are all $275,000 or less. This means both the 10th and 11th homes are exactly $275,000, making the original median $275,000. If you remove the top house, you now have 19 homes. The middle position shifts to the 10th home, which is still $275,000. The median remains the same.


📐 The Long Math Proof (For Reviewing Details)

  • Original Dataset (n=20):
    • Sum = (5 ∙ 250,000) + (8 ∙ 275,000) + (6 ∙ 300,000) + 1,200,000 = $5,450,000
    • Original Mean = 5,450,000/20 = $272,500
    • Original Median = $275,000
  • New Dataset (n=19):
    • New Sum = $5,450,000 – $1,200,000  = $4,250,000
    • New Mean = 4,250,000/19 ≈ $223,684} (The mean decreased)
    • New Median = $275,000 (The median stayed the same)
  • Correct Answer: B. The mean decreases, and the median remains the same.

The dot plots show the distribution of daily high temperatures, in degrees Fahrenheit, recorded in City A and City B over a 14-day period in July.

Dot Plot for question 22. Shows Temperature readings for 2 weeks for two cities.

Which statement truly describes the relationship between their means (μ) and standard deviations (σ)?

  • A) μ A = μ B and σ A > σ B
  • B) μ A = μ B and σ A < σ B
  • C) μ A > μ B and σ A = σ B
  • D) μ A < μ B and σ A < σ B

🧭 The SAT Concept: Skewness vs. Symmetry

On the digital SAT, you don’t need to waste time calculating standard deviation or means by hand. You can solve this purely by looking at the balance of the data points.

Step 1: Compare the Means (μ). 

    • City B is completely symmetrical. The data points on the left perfectly mirror the data points on the right, which places its balancing center (mean) exactly at 88 degrees.
    • City A is skewed to the left. It has a heavy cluster of low temperatures (three days at 85) pulling the average down, with fewer high-temperature days to balance it out. 
    • Because the bulk of the data is on the lower end, City A’s mean is smaller than City B’s mean (). This immediately narrows our choices down to Option D!
    •  
  • Step 2: Verify the Standard Deviation (σ). Standard deviation measures the variation or dispersion of the data.
    • In City A, the vast majority of the data is packed tightly together at the low end (7 out of the 11 days are clustered between 85 and 87).
    • In City B, the data is pushed out heavily to the extreme outer edges (3 days at the absolute minimum of 85, and 3 days at the absolute maximum of 91), creating a much wider total spread.
    • Because City B’s data points are more spread out from its center, City B has a larger standard deviation. Therefore

σ A < σ B.

  • Correct Answer: D. μ A < μ B and σ A < σ B.

Maximize Your College Potential with MyTutorLesson

My Tutor Lesson LogoMastering the SAT Math section isn’t about memorizing confusing shortcuts — it is about learning to recognize the core mathematical frameworks that govern every single question on the test. When you understand how a linear equation functions or how data shifts layout, trick questions transform into easy points.

At MyTutorLesson, our premier SAT & ACT Math Test Prep Programs help high school students break through score plateaus and build absolute testing certainty. We provide highly personalized tutoring, real-time pacing adjustments, and deep algebraic reviews that empower your student to dominate competitive admissions standards and claim their spot at top-tier universities.


Make this summer count.